Unaudited Financial Statements Announcement For the Six Months ended 31 December 2025
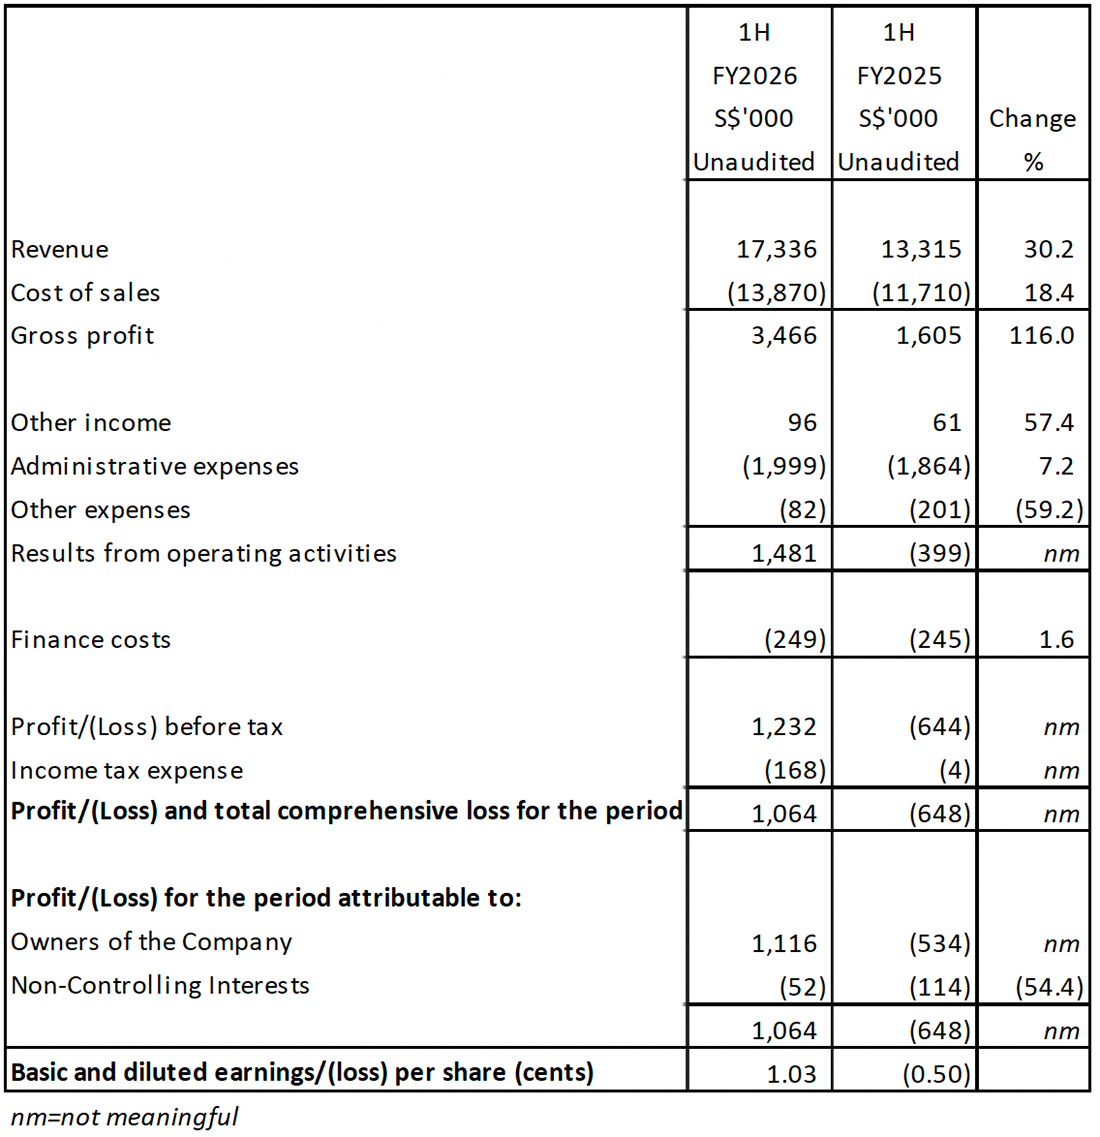
Profit or Loss
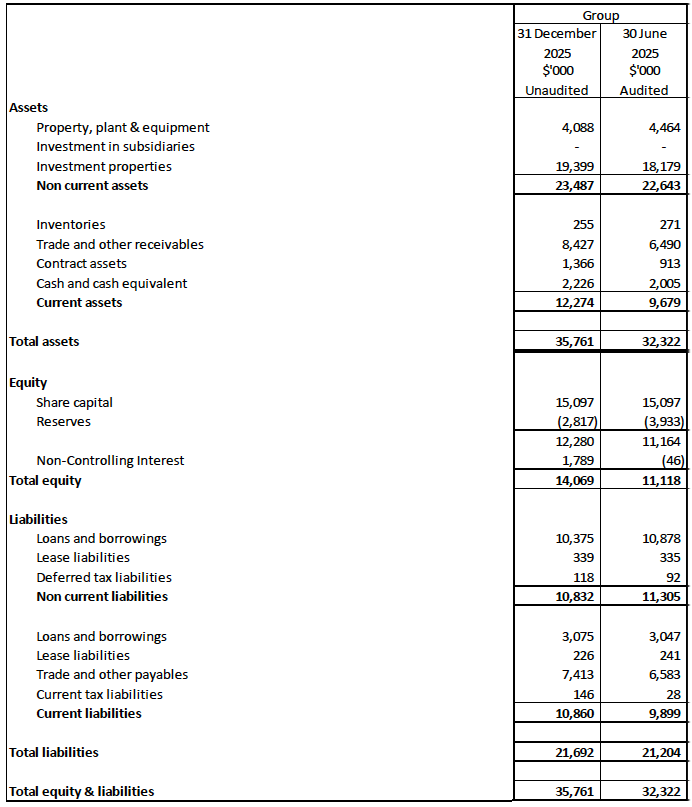
Balance Sheet
Review of Performance
A. Consolidated Statement of Comprehensive Income (1H FY2026 vs 1H FY2025)
- Revenue:
Total revenue increased by $4.02 million or 30.2% from $13.31 million in 1H FY2025 to $17.33 million in 1H FY2026. The increase in revenue is attributable to improvement across all business segments. The Engineering Services business segment saw greater revenue recognition from ongoing projects while the Transport Services segment secured contract renewals with expanded scope of work and improved margin terms. The Security and Manpower Services business onboarded new customers in 1HFY2026, with some existing customers expanded project requirements. 1HFY2026 saw full contribution from Investment Properties segment, where Amethyst House is 100% occupied while the Beryl House is seeking the required regulatory approvals for partial conversion to workers’ accommodation.
- Cost of Sales:
Cost of sales increased by $2.16 million or 18.4% from $11.71 million in 1H FY2025 to $13.87 million in 1H FY2026. The increase was in line with the increase in total revenue.
- Gross Profit:
Gross profit increased by $1.86 million or 116.0% from $1.61 million in 1H FY2025 to $3.47 million in 1H FY2026. Correspondingly, the gross profit margins improved from 12.1% in 1H FY2025 to 20.0% in 1H FY2026. The increase was due to higher profit margin contracts were executed in 1H FY2026.
- Other Income:
Other income increased from $0.06 million in 1H FY2025 to $0.1 million in 1H FY2026. This was mainly due to increase in government grants received in 1H FY2026.
- Administrative Expenses:
Administrative expenses increased from $1.86 million in 1H FY2025 to $2 million in 1H FY2026, mainly due to increase in managerial and administrative staffs’ remuneration.
- Other Expenses:
Other expenses decreased from $0.2 million in 1H FY2025 to $0.08 million in 1H FY2026 mainly due to a decrease in depreciation of right-of-use (ROU) assets relating to rented premises.
- Finance Costs:
Finance costs remain stable at approximately $0.25 million in 1H FY2025 and 1H FY2026.
B. Consolidated Statement of Financial Position as at 31 December 2025
- Non-Current Assets:
Non-current assets increased to $23.49 million as at 31 December 2025 from $22.64 million as at 30 June 2025, mainly due to the renovation of an investment property during 1H FY2026.
- Current Assets:
Current assets increased to $12.27 million as at 31 December 2025 from $9.68 million as at 30 June 2025. This was mainly due to increase in other receivables for deposit paid for acquisition of investment property.
- Non-Current Liabilities:
Non-current liabilities decreased to $10.83 million as at 31 December 2025 from $11.31 million as at 30 June 2025. This was mainly due to repayment of loans and borrowings.
- Current Liabilities:
Current liabilities increased to $10.86 million at 31 December 2025 from $9.90 million as at 30 June 2025, mainly due to higher customer deposits, which comprise security deposits collected from tenants and advance collections from contract customers.
C. Consolidated Statement of Cash Flows (1H FY2026)
-
Net cash generated from operating activities in 1H FY2026 amounted to $1.96 million. This was mainly due to operating cash flow before working capital changes of $3.02 million, partially offset against increase in trade and other receivables.
-
Net cash used in investing activities in 1H FY2026 amounted to $2.25 million. This was mainly due to the renovation of an investment property.
-
Net cash generated from financing activities in 1H FY2026 amounted to $0.52 million. This was mainly due to additional proceeds from non-controlling shareholders of subsidiaries, offset with repayment of lease liabilities and loans and borrowings.
Commentary
The Group anticipates an improved financial result for both revenue and profitability in the second half of FY2026 as compared with 1H FY2026, underpinned by recent contract wins across all business segments, ongoing efficiency gains, and a supportive industry and operating environment.
For our Engineering Services, new contracts secured in 1H FY2026 are progressively recognised in 2H FY2026, which should lift the Engineering segment’s revenue in the coming months. We are actively executing our project pipeline and continue to pursue additional projects from Singapore’s robust construction sector. Notably, the Building and Construction Authority (BCA) projects that construction demand in 2026 will remain high at approximately S$47–53 billion, comparable to 20251. In addition, industry forecasts indicate construction output could grow by around 7% year-on-year in 2026, reflecting a sustained pipeline of infrastructure and development projects (e.g. Changi Terminal 5 development, Marina Bay Sands Integrated Resort expansion and New Tengah General & Community Hospital, Downtown Line 2 Extension and Thomson-East Coast Line Extension). The Group remains focused on cost management and execution efficiency to improve project margins, even as we scale up activity in this segment.
For our Transport Services, the division has secured several contract renewals with expanded scope and improved margin terms in recent months. These renewed contracts, alongside new transport contracts won, will be progressively delivered from 2H FY2026 and are expected to bolster revenue in this segment. The improved deployment of our bus fleet and manpower has already reduced idle capacity, and the incoming projects are expected to further increase asset utilization. As a result, we anticipate the Transport segment to maintain its positive momentum, contributing steady earnings in 2H FY2026. Whilst the stable demand from corporate and ad-hoc charter clients will continue to sustain this segment’s performance, we remain vigilant on fuel and operating costs.
For Security and Manpower Services, the division secured new projects which will be executed and recognised in 2H FY2026 with expanded project requirements from existing clients. These wins, with reputable private sector clients, are expected to drive revenue growth for the division in the second half. We remain conscious of manpower cost inflation and labour availability, and will manage these factors closely to sustain the division’s performance.
For our Investment Properties, the Group’s second dormitory is on track to become operational in 2H FY2026. This new facility – together with our existing fully occupied 299- bed dormitory – will more than double our dormitory capacity, significantly boosting our recurring rental income base in the coming periods. Market conditions for worker accommodation are favourable2 with industry data showing that occupancy rates in Singapore’s purpose-built dormitories are averaging about 96–97%, with bed rental rates now markedly higher than pre-pandemic levels. This reflects a persistent demand-supply gap in migrant worker housing amid the ongoing construction boom. While the government has announced plans to incrementally add around 45,000 dormitory beds over the next six years to ease the shortage, this new supply will be introduced gradually. Underlying demand is expected to remain robust, supported by large infrastructure projects and sustained foreign worker inflows. Given this backdrop, we are optimistic that our new dormitory will achieve high occupancy quickly, contributing positively to the Group’s revenue and profit in 2H FY2026. The dormitory business provides a stable, longterm revenue stream, and we will continue to ensure high service standards and compliance with new regulatory requirements.
On the back of core and overall inflation staying at 2025’s high of 1.2%, the Monetary Authority of Singapore and Ministry of Trade and Industry have said that Singapore could see greater price pressures in 2026 with imported costs declining at a slower pace and regional inflation picking up modestly.3 Labour costs domestically could also start to increase as productivity growth normalised.
Barring unforeseen circumstances, the Board is cautiously optimistic that the combination of new business wins, improved operational efficiencies, and supportive industry conditions will translate into a stronger financial performance in the second half of FY2026, compared to 1H FY2026. The strategic initiatives undertaken in the past year – diversifying revenue streams and strengthening our cost structure – have positioned the Group well to sustain this improvement beyond FY2026. Nevertheless, we remain vigilant of potential challenges, including rising operating costs or macro-economic uncertainties, and will continue to manage these risks proactively.
Overall, the Group is confident that the positive momentum is sustainable and we are committed to delivering long-term value to our shareholders through disciplined execution of our growth strategy.
1 BCA, Steady Construction Demand In 2026 As Singapore Steps Up Support For Built Environment Firms Through Collaboration And Innovation
2 SBR, Tight supply, rising rents spur interest in worker dormitory sites
3 MTI, Consumer Price Developments in December 2025